If you are looking for new ways to grow your business, customer analytics should be high on your agenda. It puts the customer into the center of your efforts, by learning as much as possible about her persona and actions and helps making fact-based decisions on these insights.
Nowadays, there are plenty of possibilities for gathering data about your customer and her interactions with your company and product. Structured information can be captured from many different sources, like credit card purchases, loyalty cards, subscriptions, user-generated reviews or surveys. Multiple touch points, like the company website, customer support or social media can give valuable insights about the relationship between your customer and company.
Gathering and analyzing this data allows valuable insights into behaviors, habits and lifestyles of the customer, and thus will help building deeper and more successful relationships with your customer.
If done right, the impanct of customer analytics can be significant for commercial success and have an impact on customer service, customer experience, customer management, digital marketing and all other areas of marketing. This will lead to better decision making and actionable insights, and as a result, enhanced customer satisfaction, loyalty, engagement and spending and ultimately drive sales growth.
Some interesting aspects of Customer Analytics
Customer Segmentation: Group your customers into small and homogeneus clusters using distinct characteristics, like demographics or behavior
Customer Acquisition & Conversion: Find actions to be taken to convert a free user or visitor into a customer
Customer Response Prediction: Predict, how your customer will react to marketing actions
Market Basket Analysis: See, which products your customers like and need
Sentiment Analysis: Find out, what customers and soon to be customers think about your company
Customer Lifetime Value: Identify your most valuable customers and customers with potential
Customer Churn Prediction: Prevent churning of high value customers by predicting the risk of churning for each customer to alert, if action for customer retention needs to be taken
Recommendation System: Tell your customer, what she needs next
In this project I will be taking a deeper look at Customer Segmentation, done in Python and Tableau.
Customer Segmentation
The goal of customer segmentation is to give customers a personalized experience tailored to each customer or segment of customers with similar characteristics.
This can be achieved by the creation of customer profiles and marketing to distinct parts of the consumer audience differently by customizing the offerings for each segment.
Often used characteristics used for Segmentation are demographics, psychographic and behavioral attributes, or geographic properties. Successful segmentation often combines multiple methods. Another way to determine segments can be done by customer-lifetime-value modeling.
When doing customer segmentation, the higher the level of granularity, the better. The best-case scenario would be a 360 degree-view of each customer, their opinions, lifestyle-choices and consumption. A customer could be moving along different segments over time and it could be interesting, to see how their journey looks like and which factors have played a role.
Frequently used behavioral models are based on an analysis of recency, (when was the last purchase), frequency (how often did the customer make purchases) and monetary value (how much did she spend in total).
The dataset used in this example contains information about purchases at an online retailer selling „unique all-occasion gifts“. The customers are mostly wholesalers.
As there is not much information in the dataset about the customer, a behavioral analysis will be performed, looking at recency, frequency and monetary value of purchases and see, where the customers are based.
Data Cleaning and Exploration
Dataset, Notebooks and Workbook
The Dataset stems from the UCI Archive:Online Retail Data Set. The Tableau Workbook can be foundhere. And the Jupyter Notebooks can be viewed at GitHub here.
Check the data for consistency, completeness and correctness and get an overview of statistical parameters.
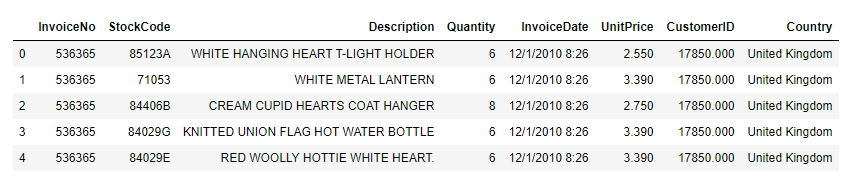
The Dataset consists of 541909 Instances and 8 Columns which are pretty much self-explanatory:
InvoiceNo
StockCode
Description
Quantity
InvoiceDate
UnitPrice
CustomerID
Country
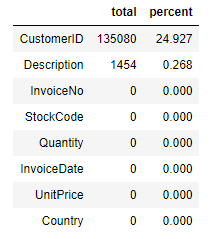
Missing Values: As Customer ID and the Description of the Items cannot be inferred, the instances containing missing values will be removed from the dataset.
Duplicates: There are 5225 Duplicates in the Dataset. One of each is removed.
Datatypes: Transformation of InvoiceDate to Datetime
Transformation of CustomerID to string
Other changes: Removal of punctuation in the Description column.
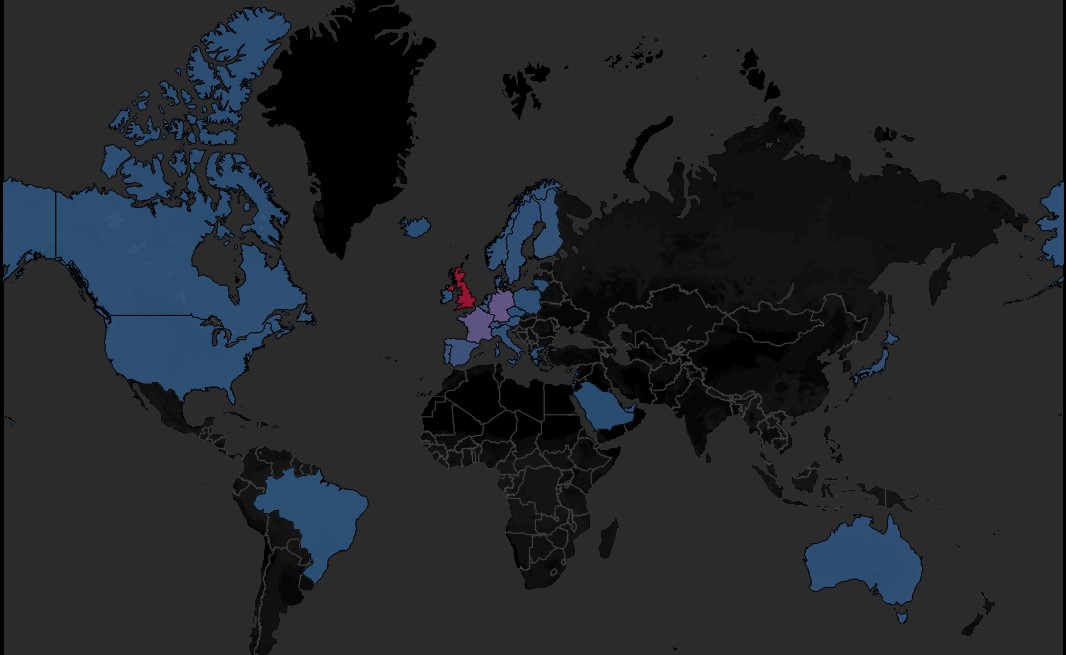
Where are the customers?
This retailer has 4372 Customers from all over the world, but the majority of the customers, 3950, are from the United Kingdom.
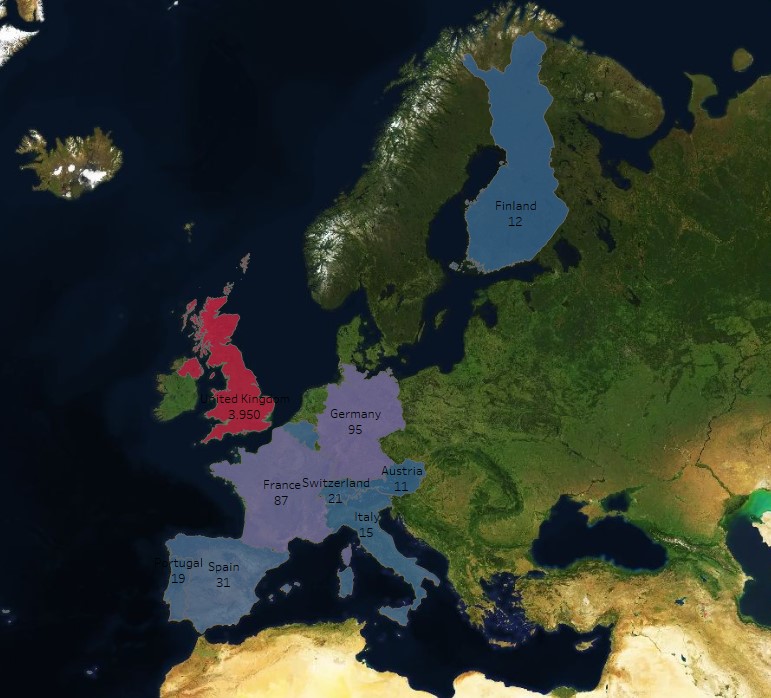
The top 10 countries for number of customers
The morst customers are from Europe.
Products
Which are the most sold products of all customers, the country with the most customers or the best customer?
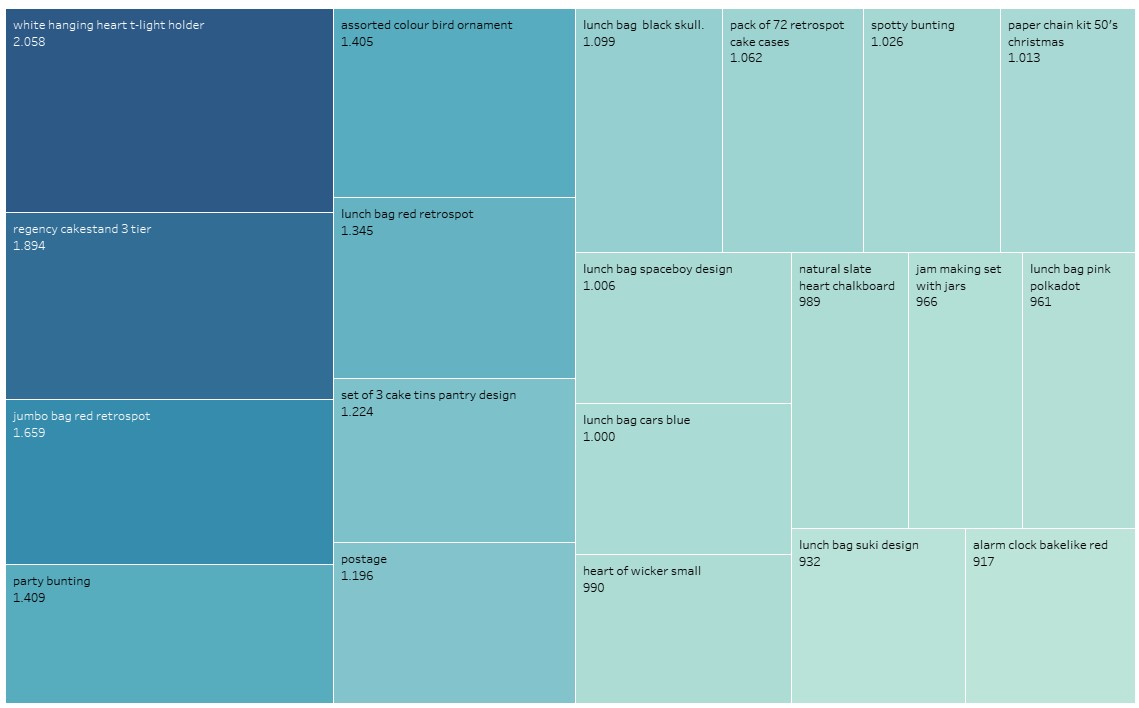
The top 20 products allover
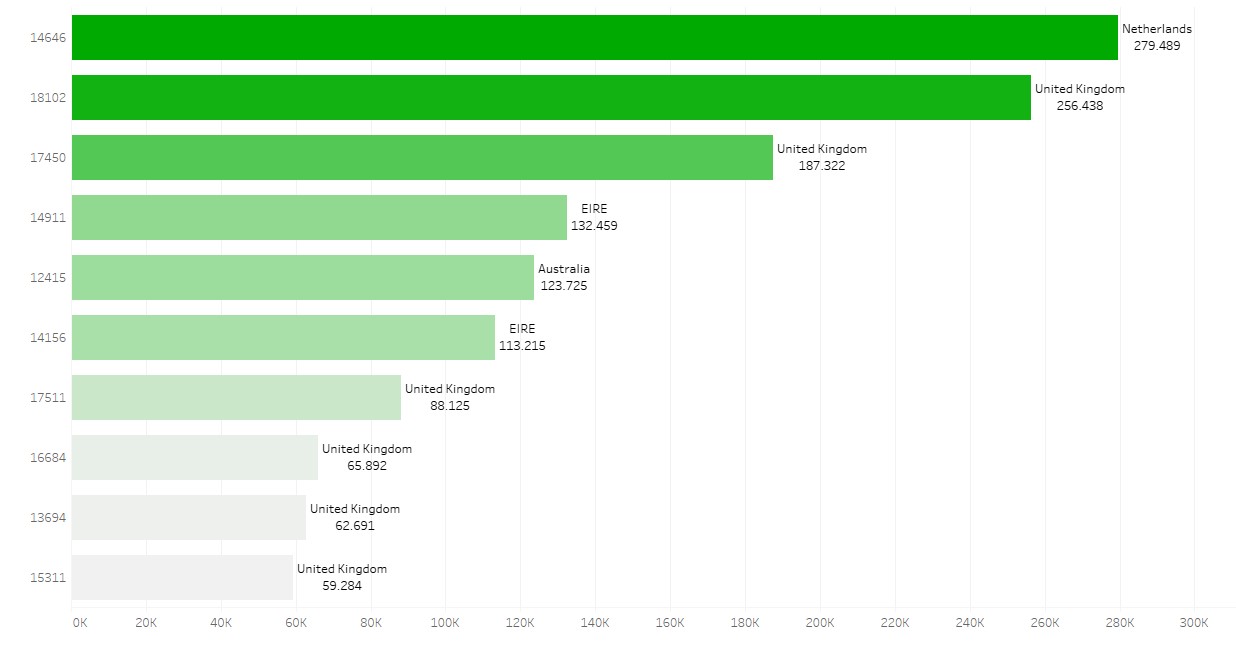
The top 10 costumers for spending: Although the UK has the most costumers, the best customer comes from the Netherlands.
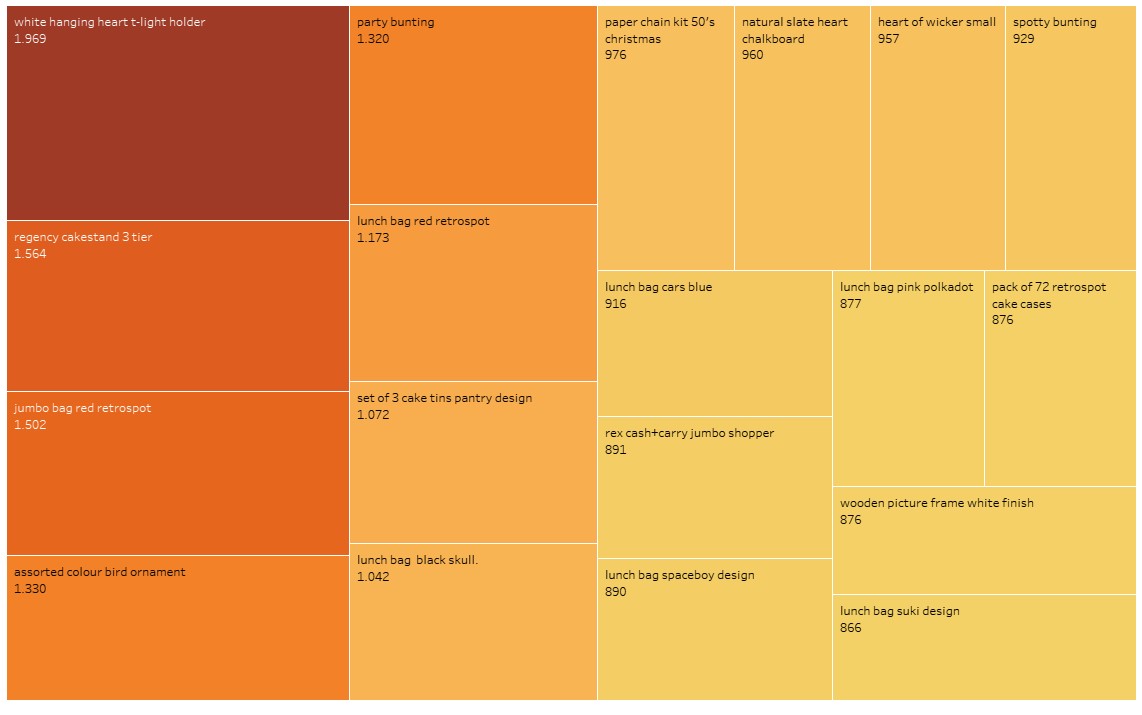
Top 20 products in the UK
The top 10 costumers for spending: Although the UK has the most costumers, the best customer comes from the Netherlands.
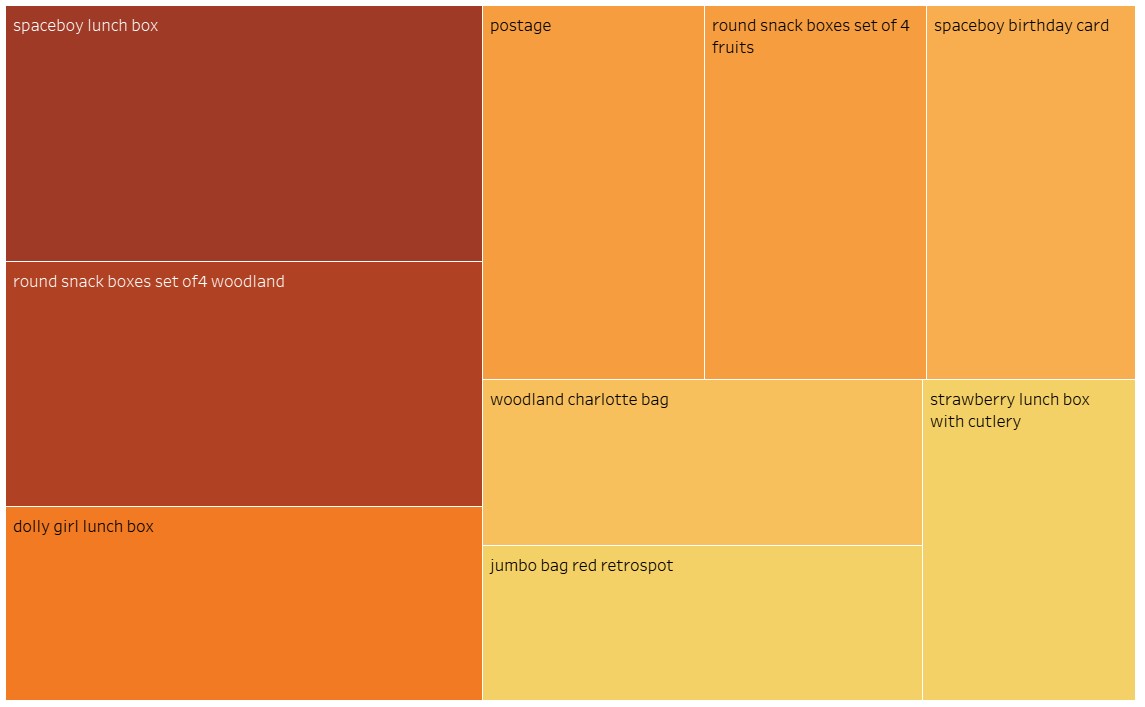
The favorite products of the best customer
The top 10 costumers for spending: Although the UK has the most costumers, the best customer comes from the Netherlands.
Shopping Behavior
How do your customers behave?
Orders by time of day
The top 20 favorites of all customers.
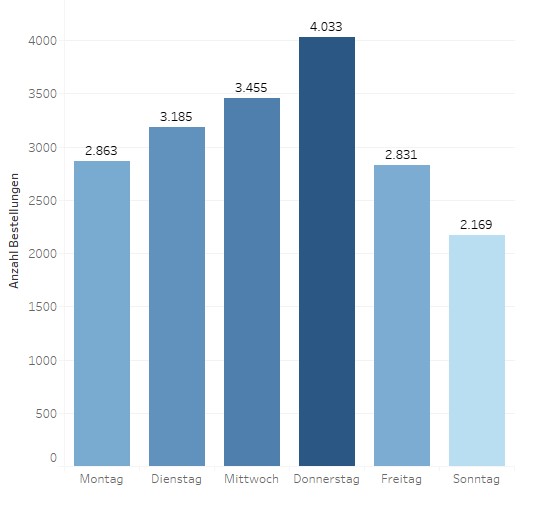
Orders by weekday
The top 10 costumers for spending: Although the UK has the most costumers, the best customer comes from the Netherlands.
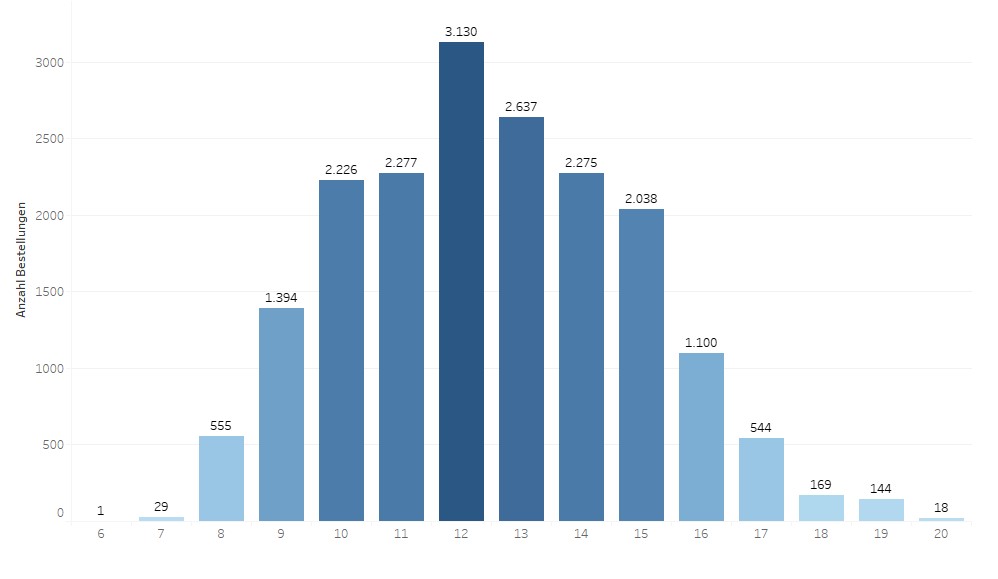
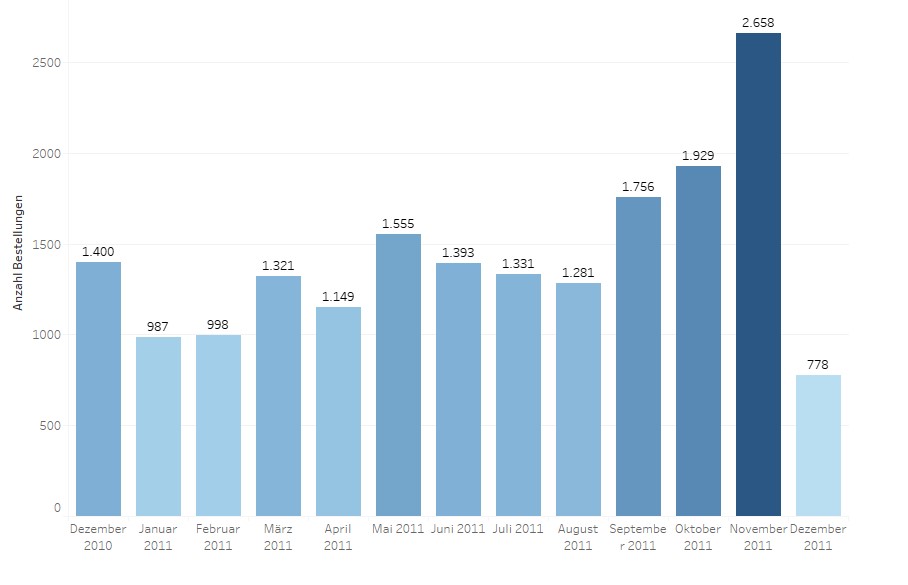
Number of active customers by season
As the customers are giftshops, they do the most of their shopping before the christmas season in november, so they are fully prepared, when december comes around.
Recency
The best weekday for orders is thursday.
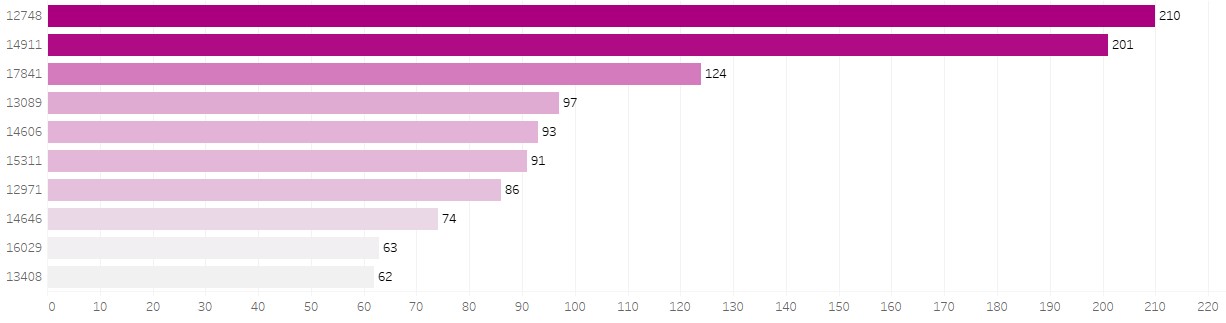
Frequency
The frequency of orders for the best customers.
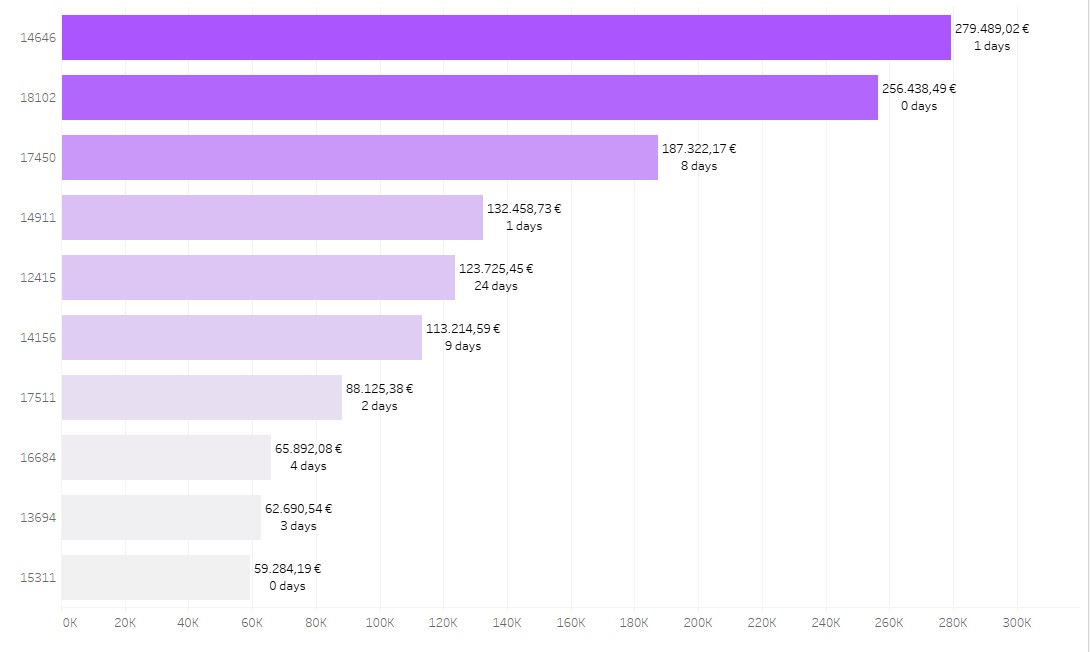
Monetary
The top 10 costumers for spending: Although the UK has the most costumers, the best customer comes from the Netherlands.
RFM in Python
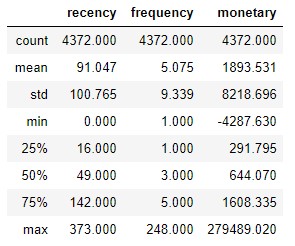
In Python, the groupby and aggregate functions were used, to create a new table for RFM. Here, the Parameters of the attributes are shown.
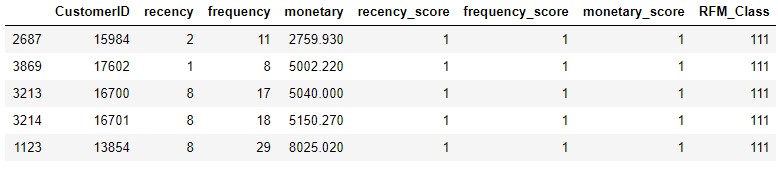
Then, a score can be assigned for each of the attributes recency, frequency and monetary and a RFM Class can be constructed.
Conclusion
For customer segmentation, RFM is a quick and easy method to pinpoint your most valuable customers. It can be done in Tableau and of course in Python.